
Microsoft Excel is one of the most popular MS applications in today's business world. The application is used in recording data and eventually in creating meaningful charts for visual data. However, most people face issues when they are considering taking some of the actions with excel.
Legend names are created automatically from the data in the cells above every column or row of data that are being utilized for the Chart. If you are considering changing eh legend names, then you can do this by updating the information in those cells. The other thing to do is to update the default legend name with the use of Select data.
This short article will cover all you want to know about legend text and eventually guide you along on how to change legend texts in excel. Before we move on, let me, first of all, make it clear that if you skip the use of column and row headers when creating a chart, the application will use default names. The default names start with "series 1".
How to show Excel legends on Chart
The main reason why a legend is in the Excel chart is to explain what type of data is being displayed in any of the colors. Legend contains a simple square that shows the descriptive text and the color. A good example is a chart that compares voter turnout for the last three voter seasons from 2000 in the USA. The legend will show which color in the Chart stands for each of the general elections.
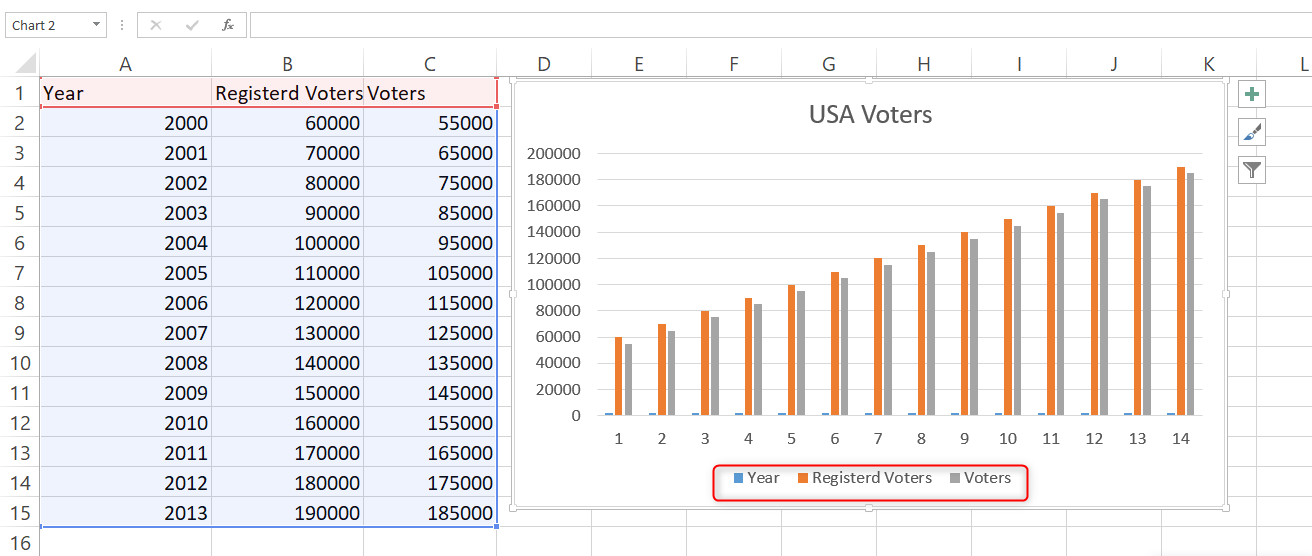
When you are creating a chart with that data, you are unlikely to see the legend displayed. What you are supposed to do is to fix this by selecting the entire Chart. After this, click on the plus sign button that you can check on the right of the Chart.

What follows here is to toggle on legends from the element menu. If you want to see the locations of the legend on the chart, you can click on the small black arrow in the Chart. With that in mind, let`s move to the other step.
How to edit the legend in Excel
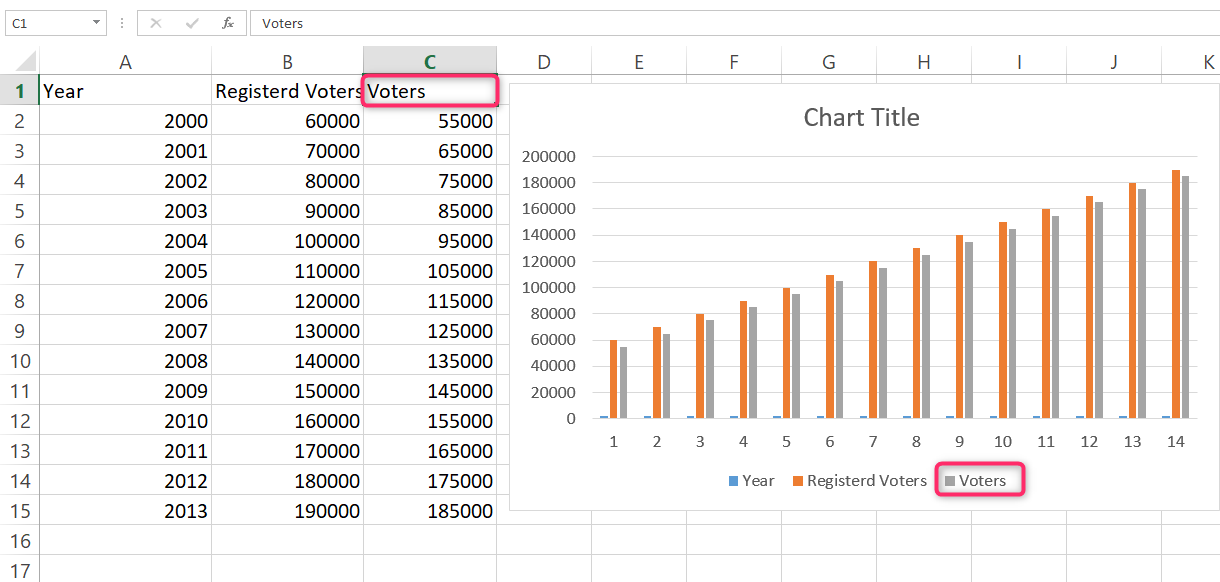
Let`s start by assuming you have a column of voters named "Voter Turnout." If you start by selecting the entire column, including the title, you will realize that the title text will appear in the legend for the axis representing the column data.

So, if you now want to update the texts in the cell, the legend text will update automatically. If the application cannot find the text in the top cells of the column, then it will be updated "series 1".
Use the select Data source Dialog
I bet you have already noted that the legend will change when you change the series name in Excel. Though you can select the Chart, and use the right mouse button, pick the data from the menu to access the select data source dialog, which will allow you to edit the series name. The application will display the select data source dialog. After this, you will also find select data on the chary, Tools design tab after the Chart is selected.

Now pick the legend name that you want to change from the Legend Entries or the series list. This is found on the left of the dialog. After this click on Edit Button and eventually type a name into the series name text box. After this click Ok to dismiss the Box.

After this, you are supposed to select the Data Source dialog and the legend name will update now. However, note that changing the legend name with the dialog will not change the text that is containing data in the column.
How to format an excel legend
You can actually change the appearance of a legend after it is displayed in Excel Chart. To do this, right-click on the legend and pick Font from the menu. After this use the Font dialog to change the size, color and also add some text effects. You can underline or even strikethrough. Now pick Format Legend after clicking on the right to show the Format legend task pane. This pane has three sections with formatting options.

The first one is Fill & Line and the second one is Effects and the last one is Legend options. In the first section, you can fill the background of the legend text and also add a border. The bother thing is to let the legend stand out with the visual effects such as glow and shadow and lastly control the location of the legend in the Chart.