A trendline is a line in an Excel chart similar to a line of best fit. A trendline is usually a curved line showing the chart's trend. A trendline is an analytical tool geared towards showing the movement of the data in a chart. A trendline is somehow similar to a line graph. However, the Trendline does not connect all points in the chart as the line graph does. In this article, we shall discuss adding trendlines to excel charts.
Using the Chart Element Tool
Here are the steps to follow:
1. Open the Excel application.
2. To get started, you need to create a chart. Therefore, add the dataset of your chart to the empty cells.

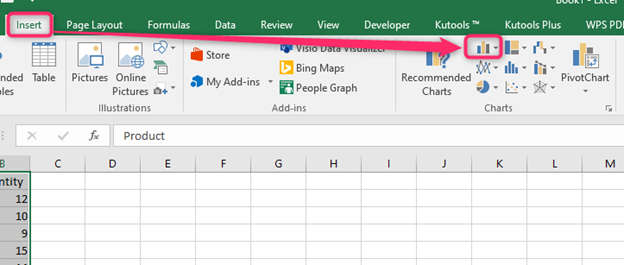
3. Highlight the dataset you've entered. Click the Insert tab on the ribbon, and locate the Charts section. Under this section, choose any of the 2-D charts.

4. The chart will automatically be inserted into the worksheet. Then, click anywhere on the inserted chart.
5. Locate the Plus sign symbol (Chart Element tool) on the left side of the chart.

6. In the Chart Element menu, check the Trendline checkbox. The Trendline will be added to your chart.

7. Then, hover the cursor over the Trendline button and select the type of Trendline you want to apply to your chart.

Using the Add Trendline feature
Here are the steps to follow while using this method:
1. Open the Excel application.
2. To get started, you need to create a chart. Therefore, add the dataset of your chart to the empty cells.
3. Highlight the dataset you've entered. Click the Insert tab on the ribbon, and locate the Charts section. Under this section, choose any of the 2-D charts.

4. The chart will automatically be inserted into the worksheet.
5. Then, click any of the chart bars. Right-click on the selected chart bar. From the side-view menu, click the Add trendline button.

6. On clicking, a trendline will be inserted in your chart.

To change the Trendline type.
Follow these steps:
1. Double-click on the added Trendline to open the Format Shape pane on the right side of the screen.
2. From the pane, click on the Chart icon tab.

3. Locate the Trendline Options section, and select the Trendline type you want by toggling its button.

4. That's all you need to do.
To change Trendline Name.
Excel allows users to change the default name of trendlines. Below are the steps to achieve this:
1. Double-click on the added Trendline to open the Format Shape pane on the right side of the screen.
2. From the pane, click on the Chart icon tab.

3. Locate the Trendline Name section, then toggle on the Custom button.
4. In the textbox next to the Custom section, add the name of your Trendline.

5. Finally, hit the Enter button.
Types of Trendline
They include:
1. Exponential Trendline: This type of Trendline is used for datasets with positive values.
2. Logarithmic Trendline: This Trendline is used when the data increase and decreases quickly.
3. Linear Trendline: It is used for simple datasets.
4. Polynomial Trendline: These curved lines are used for positive datasets.
5. Moving Average: It is used if your data has large fluctuations.
