
Z score also known as the standard score, is a statistical measurement. It is used to determine the number of standard deviations a number is above or below a mean. Initially, manual methods were used to calculate Z scores and this proved to be tiresome. With the introduction of Excel, everything changed drastically. The process of calculating Z scores became easier and more enjoyable.
To use Excel to calculate Z score, these workarounds are involved.
1. To get started, open your excel and the empty cells, enter your data. If you have your data ready, proceed to the next step.

2. To calculate the Z score of any dataset, you have to first calculate the mean and standard deviation of that dataset.
3. Firstly, let calculate the mean. Select an empty cell where the mean value will be saved, and then click on it.
4. Locate and click on the "Formulas" bar. Navigate and locate the More functions button. Click on its drop-down menu.
5. On the drop-down menu, hover your cursor on the" Statistical" button to open a side-view menu. On the side menu, select the "Average" button and click on it.

6. On clicking, a "Function argument" dialogue box opens. Highlight the column that has marks, and then click the "Ok" button. Alternatively, you can manually enter the address of the first cell in the column and the last cell that houses the marks.

After clicking the "Ok" button, the mean of your dataset will appear on the cell you had earlier selected.
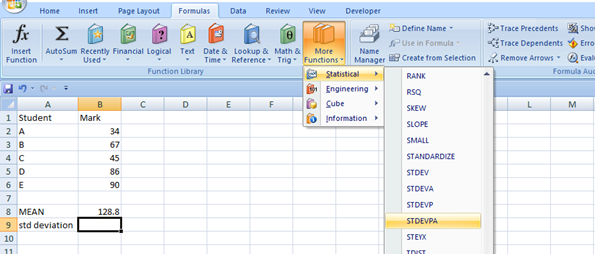
7. Now let calculate the standard deviation of our dataset. Similarly, click on another empty cell where the result of the standard deviation calculation will be stored.
8. Go to the Formulas tab. Then, click on More Functions located within the Function Library section. Click on its drop-down menu. Hover your mouse on top of the "Statistical button." On the side-view list, choose "STDEVPA" and a Function Argument dialogue box will be opened.
8. On the dialogue box, select all cells with marks data and click the "ok" button.

9. Now you have both the mean and standard deviation of your dataset. Let us now calculate the z score of the data set. To do so, follow these steps;
- Name another column as " Z score." This column will hold the z score value for each student.

- Click on the first cell within the Z score column.
- Go to the Formulas bar. Then, click on the More function button. From the menu displayed, hover your mouse on the top Statistical button. From the side view menu, click on the Standardize button. To find calculate the z score a standardized function is used.

- On clicking, a dialogue box opens. Fill in all the required sections, and then click the "Ok" button.

- Then drag the formula downwards to other cells. Now you have your Z score calculated and ready to be used for statistical purposes.