Skip to content
  • Home
  • Excel Tips
    • Pivot Table
    • Vlookup
    • Worksheet
    • Tips
  • Formula
    • Formula List
    • Find
    • Convert
  • Graphs and Charts
    • Graphs
    • Charts
    • Tables
  • Calculations
  • Formatting
    • Columns
    • Cells
    • Rows
  • VBA
    • Macros
  • Terms of Service
  • Guest Post

line graph in excel 2016

How To Make A Line Graph On Excel 2016

November 28, 2022January 6, 2018 by Admin
How To Make A Line Graph On Excel 2016

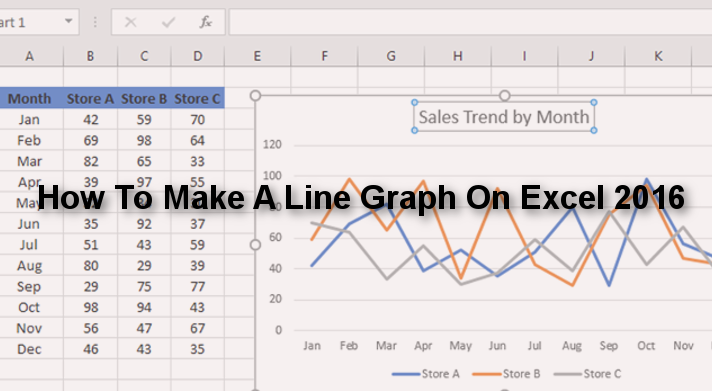
In this tutorial, we will be discussing how to create a basic line graph on Microsoft Excel 2016. Line graphs are generally used to show trends of a series of data points. It is typically used to show the behavior of a metric / data set over time (week, months yearโ€ฆ). Here are the steps

Categories Graphs and Charts Tags how to make line graph, line graph in excel 2016
  1. Admin on How to update excel to the latest versionMarch 26, 2021

    Can you please comment on the right page? Your comment is on http://basicexceltutorial.com/excel-tips/how-to-update-excel-to-the-latest-version

  2. Randy on How to update excel to the latest versionMarch 25, 2021

    your answer to "excel function count cells that contain dates" to use counta(a4:a9) only counts non blank cells. Even a…

Facebook

basicexceltutorial.com

Recent Posts

  • How to Create an Excel Dashboard for Beginners (Step-by-Step + Free Template)
  • ๐Ÿ“ŠMaster Your Loan: Build a Powerful Amortization Schedule in Excel (Free Template!
  • ๐Ÿ“‹ How to Create an Attendance Sheet in Excel
  • ๐Ÿ“‰ How to Create an Amortization Table in Excel
  • ๐Ÿ“… How to Create a Yearly Calendar in Excel
© 2025 Basic Excel Tutorial