Excel is a veritable tool for statistical analysis, and the CONFIDENCE function is one of the popular tools. When working on a population mean, you can use the CONFIDENCE function to evaluate the interval of confidence on a normal distribution. Excel has a special formula for evaluating the CONFIDENCE level, and it has diverse uses in financial analysis.
Here we go:
=CONFIDENCE()
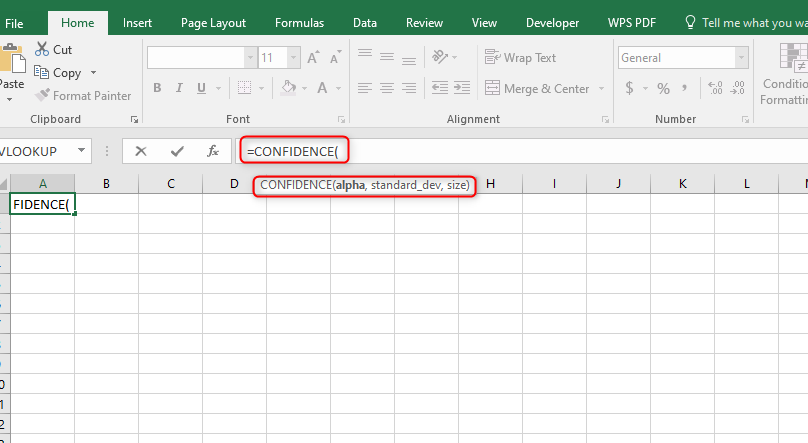
You can harness this function to predict and adjust your financial decision-making for a plethora of financial tasks.
With this function, you can easily map and apply the financial data into a large dataset.
More so, as an analyst, you can deduce vital information from the normal distribution to make excellent financial decisions. For instance, you can evaluate the relationship between the amount you earn and the amount you spend on essentials.
Here is the CONFIDENCE function formula:
=CONFIDENCE(alpha,standard_dev,size)

Alpha – Represents a significance level for computing the level of confidence. It is required at all times. The significance level is equivalent to a confidence level of 1. Similarly, a significance level of 0.05 is equivalent to a confidence level of 95%.
Standard_dev – (required argument) This is another argument, which is required at all times. It represents the standard deviation within the range of the dataset.
Size – This represents the size of the sample, and it is another required argument.
Firstly, you should find the descriptive statistics. In case you don't have the add ons:
Follow these steps:
1. On your excel menu, Click on "File", then you click "Excel options."
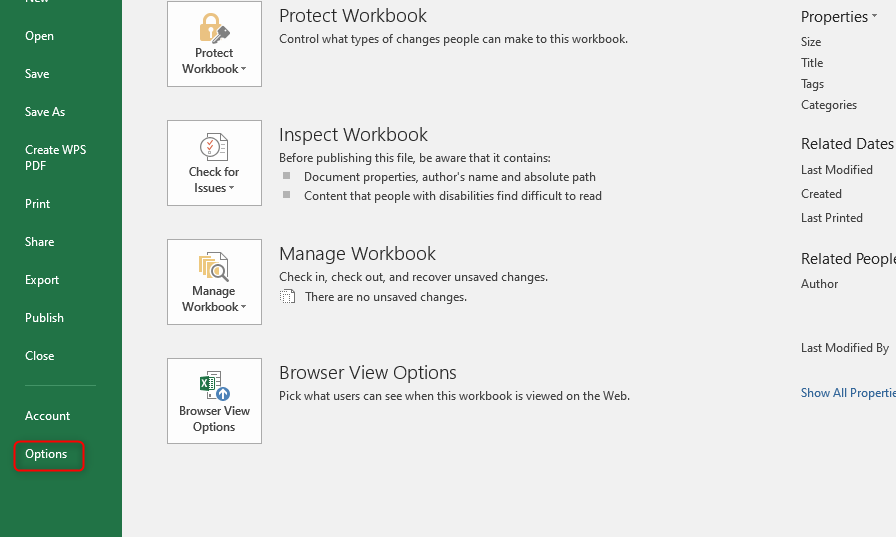
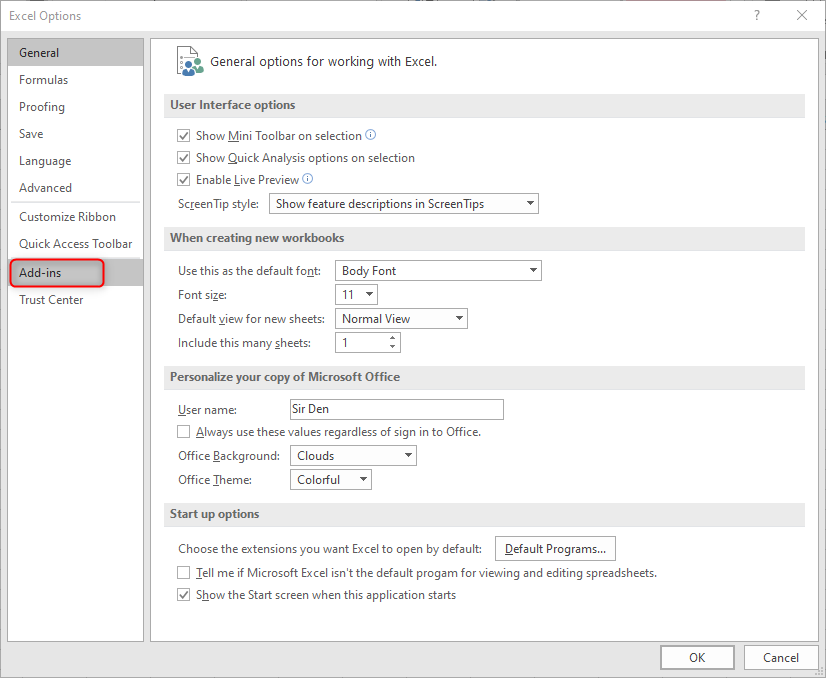
2. A new page will show up, move your cursor down and select "add ons."
3. On the add, one page, move your cursor to manage and select "excel add ons" on the options. Then click "Go."
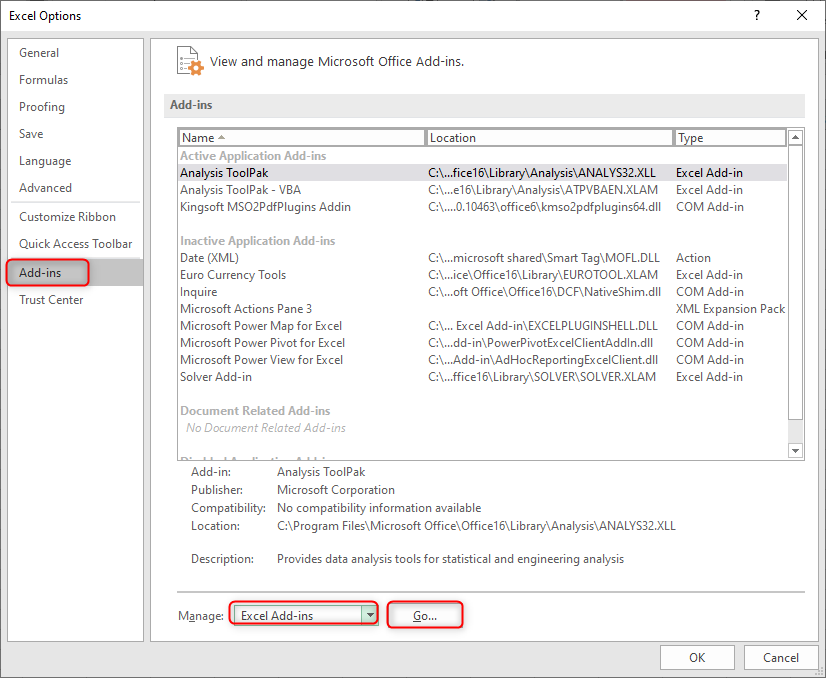
4. On the new page, check the "analysis tool pack" and the "solver add-on."
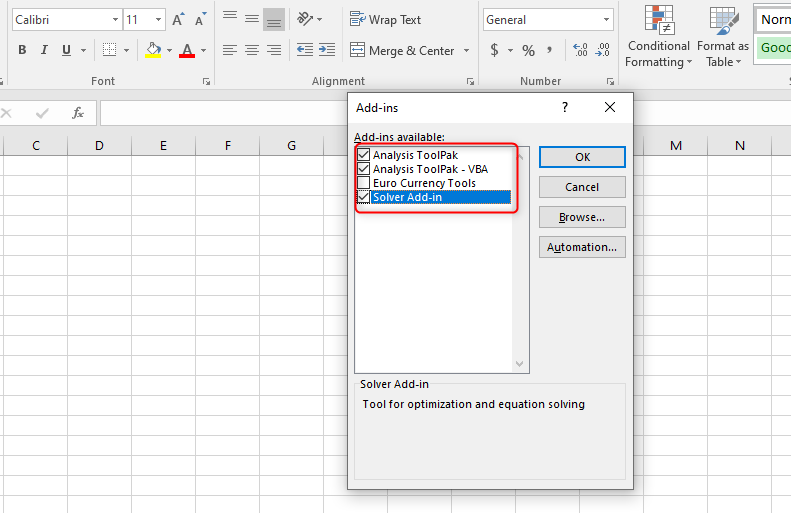
5. Then click OK.
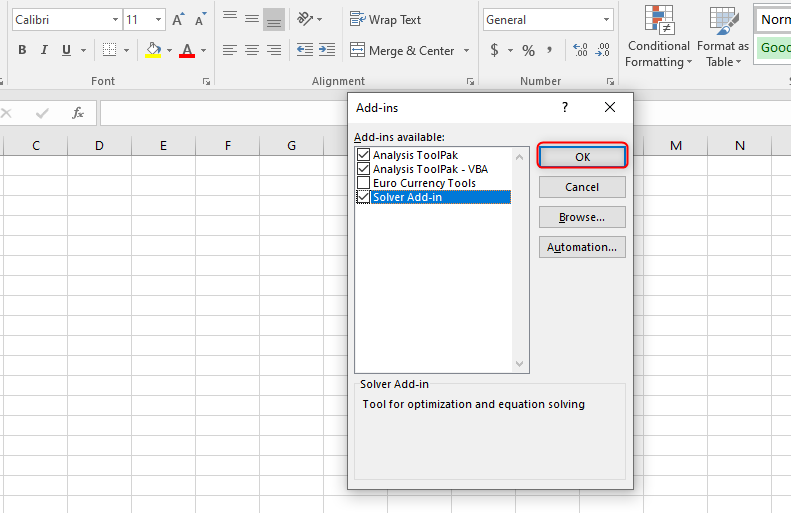
Your data analysis tool pack will be activated.
6. Move your cursor to the excel menu, and click "data". A new menu will show below it. Look for "data analysis" and click.

7. A new window will pop up. Select "descriptive statistics'' and then "OK.'

8. In the "input range", enter the number of rows that want to use. Highlight your input range.

9. Highlight the output range. The "output range" is where you want your statistics to be posted.

10. Check the boxes for the "summary statistics" and "confidence level."

11. Click OK.
12. Your result will be displayed, as shown below:

13. Select and copy the "mean" and the "confidence level" into new cells.

In our example;
The mean value is 26.914
The confidence level is 3.168155
The confidence interval is deduced by adding to or subtracting from the mean.
95% Confidence Interval = Higher range — Lower range
Higher range = Mean + confidence level
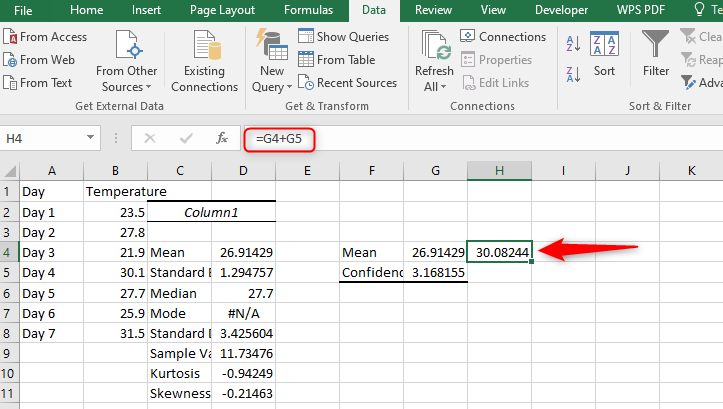
Lower range = Mean — confidence level

You can use the addition and subtraction functions on Excel to carry out the operations.
I hope this tutorial is comprehensive enough. Thanks for reading!
