Want to turn raw data into **beautiful, interactive reports**? An **Excel dashboard** makes it easy — no coding required. Whether you’re tracking sales, monitoring expenses, or managing projects, dashboards help you **see insights at a glance**.
In this beginner-friendly guide, you’ll learn how to create an Excel dashboard step by step. Plus, grab our **free ready-to-use template** and customize it for your own data.
💡 What is an Excel Dashboard?
An Excel dashboard is a **single-page summary** of your key metrics, combining **charts, tables, and interactive controls**. Instead of sifting through spreadsheets, you get a **clear visual story of your data**.
You can use dashboards for:
- Tracking sales performance
- Monitoring project progress
- Analyzing business finances
🛠 Step-by-Step: Build Your First Excel Dashboard
1. Prepare Your Data
A great dashboard starts with clean data. In one sheet, make sure to:
- Organize data in columns (e.g., Date, Category, Amount)
- Remove duplicates and blanks
- Use clear headers for easy reference
2. Plan Your Layout
Decide which metrics matter most. Your dashboard might include:
- KPIs: Total Revenue, Expenses, Growth %
- Visuals: Bar charts, line charts, pie charts
- Filters: Dropdowns for time periods or categories
Sketch a rough layout so your dashboard looks structured.
3. Use PivotTables for Quick Summaries
PivotTables make summarizing data a breeze:
Insert → PivotTable → Select Data Range → New Worksheet
You can group data by month, region, or category to quickly create summaries.
4. Add Charts & Visuals
Turn your PivotTables into visuals:
- Use **Bar Charts** for comparisons
- Use **Line Charts** for trends over time
- Use **Pie Charts** for category breakdowns
Pro tip: Add **Slicers** to make your dashboard interactive.
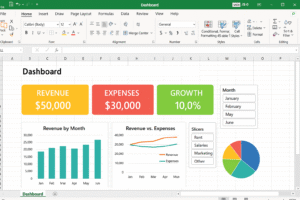
5. Assemble the Dashboard
Create a new sheet called **Dashboard**. Arrange:
- KPI cards at the top
- Charts in the middle
- Filters/Slicers on the side
6. Format for a Professional Look
- Use a **consistent color scheme**
- Hide gridlines and unnecessary elements
- Use **Shapes & Icons** for a clean design
📥 Download the Free Excel Dashboard Templates
Choose the version that suits your needs:
- Basic Dashboard – A simple version for beginners.
- Advanced Dashboard – With slicers, dynamic charts, and professional formatting.
🚀 Final Thoughts
Dashboards turn raw numbers into **actionable insights**. Start with this simple template, and as you grow more comfortable, you can add automation, advanced charts, and even real-time updates.
Looking for a **custom dashboard** with advanced visuals or automation? I can create one tailored to your needs — just reach out!
💡 Also read: How to Create a Profit and Loss Statement in Excel
💡 Need simple reporting? Check out our Excel Timesheet Template