Counting colored cells in an excel sheet are just the obtaining of numeric values of any color cells in a given data set. The purpose of coloring these data cells in excel sheets is to differentiate the cells from the other and make their data easily noted.
Coloring is one of the ways to perform filtering of data because colored data appear more visible in the same case that unfiltered data appears.
When tracing certain data in an excel sheet and finding colored cells you first deal with the colored cells with data, so in one way or the other, coloring helps save on time while sorting huge amounts of distinct data or information.
Coloring the cells in the excel sheets gives the cells a pleasing appearance and your work is usually beautiful. There are some steps to follow to color cells and also obtain a count of the colored cells.
1. for us to be able to count colored cells in excel sheets, we need to first have the excel sheet with a blue color. To do this, go to Microsoft Excel on your computer or laptop, open a blank excel sheet, and insert some data into it.

2. Select the cells that you wish to have their color changed to the blue color cell after cell. On the menu bar click on the home button and click on fill color. Select the blue color and fill it on each of the cells you wish to be in blue color.

3. Now we have the excel sheet with the data colored in blue, the next step is how we will now be to get the count of all the cells colored in blue. We will have to use the function SUBTOTAL which will help us in finding the tally of blue cells. From the data set we have just created, we would like to find the count of all blue cells from cell A1 to cell A8. We will write our formula in the formula bar as follows =SUBTOTAL (3, A2: D5), after doing that, click on the enter button to get the result.

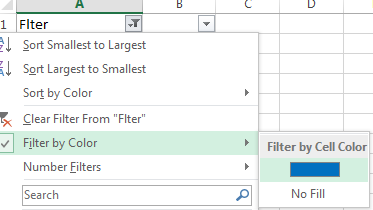
4. Then apply Filter by Data > Filter. Use the Filter by Cell Color option and results will be 8

