
Many workarounds are involved in a chart in Excel. Excel allows users to flip the dataset. However, there is no in-built tool for flipping charts in Excel, but there are workarounds that can be used to flip graphs. This article will discuss different ways of flipping graphs in Excel.
To Flip Pie Graph
Here are the steps to follow:
1. Open the Excel application.
2. Open the Workbook that contains the worksheet with your dataset. Add your dataset to the sheets if you’re using a new workbook.
3. Highlight the cells with the dataset.
4. Then click the Insert tab on the Ribbon. In the Chart section, click the Insert Pie Chart drop-down button.

5. Choose the pie chart you need to insert from the menu. On clicking, the pie chart will be added to the active worksheet. Now, let us go ahead and apply the flipping to the chart.

6. Right-click on the inserted chart, and select the Format Data Series button. A Format Data Series pane will open on the right side of the screen.
7. Click the Series Options icon on the pane. Then, click the Series options drop-down button.

8. Locate the Angle of the first slice section, type 360, and hit the Enter button.
To Flip a Bar Graph
Method 1
Here are the steps to follow:
1. Open the Excel application.
2. Open the Workbook that contains the worksheet with your dataset. Add your dataset to the sheets if you’re using a new workbook.
3. Highlight the cells with the dataset.
4. Then click the Insert tab on the Ribbon. In the Chart section, click the Insert Column or Bar Chart drop-down button.

5. From the menu, choose the Bar chart you need to insert. On clicking, the bar chart will be added to the active worksheet. Now, let us go ahead and apply the flipping to the chart.
6. Click on the Axis of the graph and Right-click. From the menu, choose the Format Axis button. On clicking, a format Axis pane will open on the right side of the screen.

7. From the pane, click on the Axis Options drop-down button. Finally, check the Category in reverse order checkbox. That is all you need to do.

Method 2
Steps:
1. Open the Excel application.
2. Open the Workbook that contains the worksheet with your dataset. Add your dataset to the sheets if you’re using a new workbook.
3. Highlight the cells with the dataset.
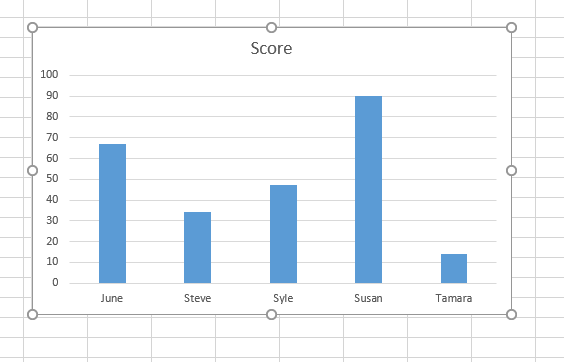
4. Then click the Insert tab on the Ribbon. In the Chart section, click the Insert Column or Bar Chart drop-down button.

5. From the menu, choose the Bar chart you need to insert. On clicking, the bar chart will be added to the active worksheet. Now, let us go ahead and apply the flipping to the chart.

6. Click on the vertical values of the graph and Right-click. From the menu, choose the Format Axis button. On clicking, a format Axis pane will open on the right side of the screen.

7. From the pane, click on the Axis Options drop-down button. Finally, check the Values in reverse order checkbox. That is all you need to do.
