
When working with **large datasets**, manually calculating totals for each group can be tedious. That’s where Excel’s **Subtotal feature** comes in handy. It automatically calculates subtotals for grouped data and even creates collapsible sections for easy navigation.
In this guide, you’ll learn how to **create automatic subtotals in Excel** step by step. Plus, download our **two ready-to-use templates** to save time.
💡 Why Use Automatic Subtotals?
Excel subtotals allow you to:
- Automatically calculate **sums, averages, counts, or other functions** for grouped data
- Create **collapsible sections** for better data navigation
- Quickly **summarize large datasets** without writing formulas manually
🛠 Step-by-Step: Create Automatic Subtotals in Excel
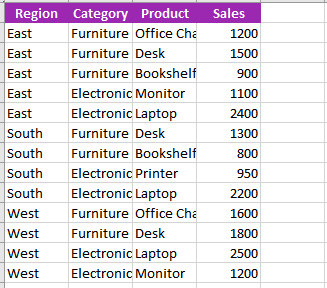
1. Sort Your Data
For subtotals to work properly, **sort your data** by the column you want to group (e.g., by “Category” or “Region”).
Go to:
Data → Sort
2. Use the Subtotal Feature
- Highlight your dataset.
- Go to Data → Subtotal.
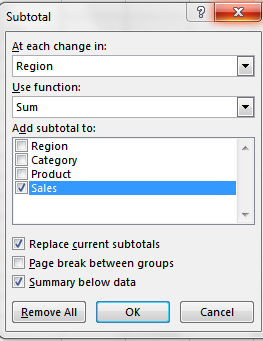
- In the Subtotal dialog box:
- **At each change in:** Select the column you sorted by (e.g., Category)
- **Use function:** Select a function (e.g., Sum, Average, Count)
- **Add subtotal to:** Select the numeric column(s) you want summarized
3. Adjust Grouping
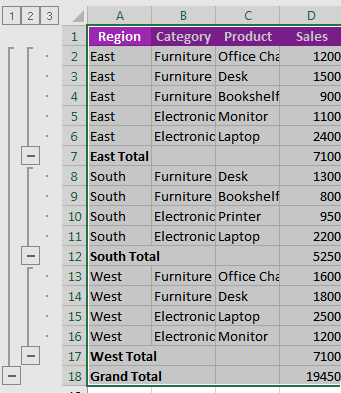
Excel will add **subtotals and collapsible grouping levels** (left margin).
Use the **+/- buttons** to expand or collapse sections.
4. (Optional) Add Multiple Levels of Subtotals
If needed, repeat the process for another grouping (e.g., first by Region, then by Category). Uncheck **“Replace current subtotals”** to keep existing levels.
📥 Download the Free Subtotal Templates
We’ve created **two prebuilt templates** so you can practice:
- Basic Subtotals Template: Simple dataset to practice grouping and subtotals.
- Advanced Subtotals Template: Multi-level dataset for nested grouping and advanced reporting.
📥 Download Basic Subtotals Template
📥 Download Advanced Subtotals Template
🚀 Final Thoughts
The Subtotal feature is one of Excel’s **most powerful yet underused tools** for summarizing large datasets quickly. Whether for sales reports, inventory tracking, or regional summaries, it saves time and keeps your data organized.
💡 Also read: How to Create an Excel Dashboard
💡 Related: How to Add Drop-Down Options in Excel